Appendix B: Methods in Depth
Analytics Review
A number of strategies were considered when undertaking the analytics review for this study. The team weighed the pros and cons of looking at all of a museum’s digital catalogues versus a specific subset and in the end chose to focus on a single catalogue per museum. Knowing that each of the catalogues produced by these museums is highly unique—not only in subject matter but in the context surrounding its creation, the way it may have been marketed, the notoriety of the art or artists within it, and so on—we hoped that by focusing on just one catalogue per museum we could reduce the number of confounding variables. The catalogues selected were each originally launched within the past five years, to avoid comparing old and new publications.
| Digital Catalogues Selected for Analytics Review | Initial Launch Date |
|---|---|
| Monet Paintings and Drawings at the Art Institute of Chicago | 2014 |
| Roman Mosaics in the J. Paul Getty Museum | 2016 |
| Dutch Paintings of the Seventeenth Century (NGA) | 2014 |
| The John G. Johnson Collection: A History and Selected Works (PMA) | 2018 |
The time frame of data collection is also important for reviewing web analytics. The team considered focusing on the first six months or first year after each catalogue’s initial publication, but in the end opted to look at the same one-year time frame for all four catalogues—June 1, 2018 through June 1, 2019. Knowing that the landscape of digital catalogues has changed over time, the team wished to avoid comparing data from 2014 and 2019.
Once the catalogues and time frames of interest were selected, the team identified a set of research questions that could be investigated through the analytics and chose a list of metrics to compile and compare. One concern for the team was whether or not to include analytics generated by users internal to each museum—for example, staff members who reference the catalogue for their work. Not all of the catalogues are currently set up to filter out this internal traffic, so the data reported here is representative of all users, including staff members.
Pop-Up Survey
The pop-up survey was designed to use generic language that could apply to any of the institutions and any of their catalogues. The survey was built in Survey Monkey, which produces coding that is easily embedded on any website. The NGA and AIC embedded the survey invitation on all of their digital catalogues (a total of six catalogues for the NGA and fourteen for AIC). The Johnson catalogue is the PMA’s only digital catalogue, and the pop-up survey was also implemented there. Each institution placed a delay on their pop-up survey to allow users a chance to begin browsing the catalogue before receiving the survey invitation. The NGA chose a 10-second delay, while the PMA and AIC both used a 20-second delay.
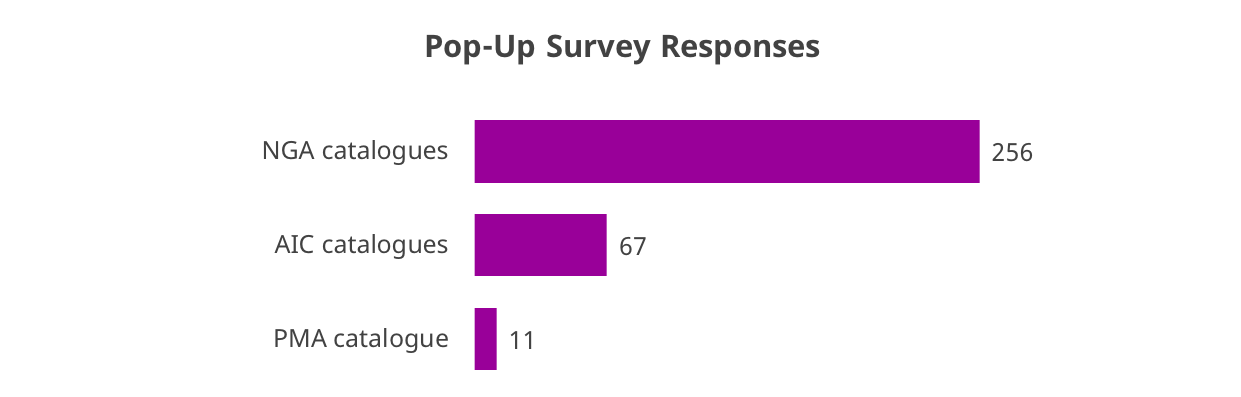
The pop-up surveys collected a total of 334 responses over a 44-day period between late July and early September. Most of the responses were gathered from the NGA catalogues, possibly due to the shorter delay set on their pop-up invites.
Email Survey for Potential Users
The four partner institutions each selected one catalogue to focus on for the email survey, making sure that the catalogues selected included key features that the team wanted reviewed. Participants who took the survey were randomly assigned to review a catalogue from one of the four partner institutions.
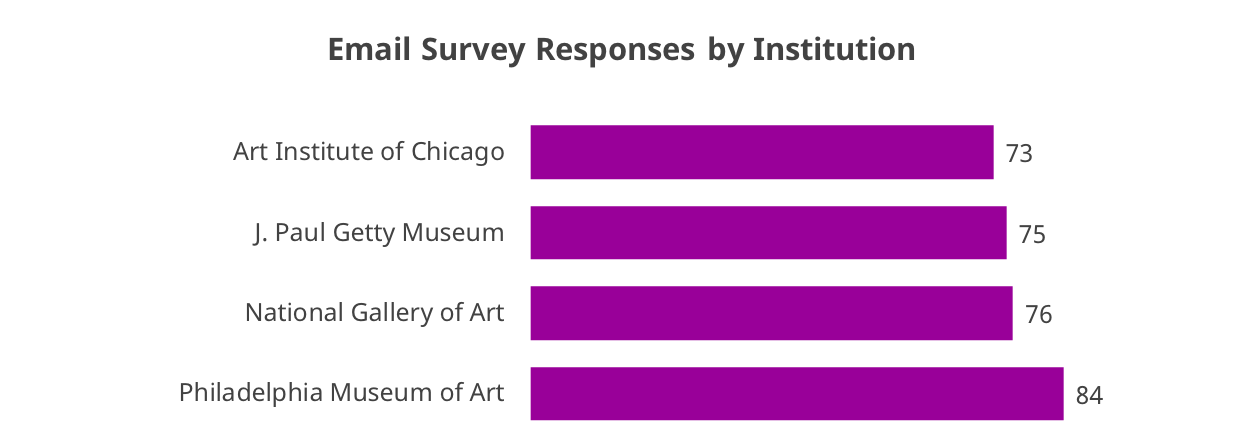
The email survey for potential users was distributed to over 1,400 contacts. These contacts primarily came from mailing lists generated by the AIC/Getty/NGA/PMA team. The lists included alumni of the NGA’s Center for Advanced Study in the Visual Arts (CASVA), marketing targets contacted by the PMA in the course of its front-end catalogue research in 2017, and departments of art history and related disciplines at institutions of higher education across the United States and abroad. The survey was also distributed via listservs and through professional organizations that represent the target audience of the catalogues, such as Curators of Dutch Art (Codart), the Conservation distlist, and the Association of Art Museum Curators (AAMC). Participants who completed the survey were entered in a gift card drawing to incentivize participation. The survey ran for just under a month from late July to late August 2019 and collected 308 responses in that time.
The random assignment of catalogues ensured roughly even sample sizes for the four institutions. Not all participants completed the survey after beginning it, however, which resulted in slightly higher counts for some catalogues than others.
The email survey also served as a recruitment tool for the focus groups. At the end of the survey, participants had the option to check a box if they were interested in participating in the focus groups in exchange for a $150 honorarium.
Focus Groups
Email survey participants were able to indicate their interest in being a part of the focus groups at the end of the survey. Once the email survey had run for several weeks, this list of potential participants was organized by profession in order to seek equal feedback from the following groups:
- museum professionals
- professors/scholars/researchers
- conservators
- librarians and archivists
- graduate students
Five individuals were recruited from each group for a total of 25 individuals. Once individuals were recruited, they were provided with their homework assignment and given approximately one week to complete it in advance of their scheduled group discussion. The homework required participants to review the same four catalogues from the survey in greater depth and provide feedback on the following:
- initial reactions to the catalogues
- catalogue structure and navigation
- artwork entries and images
- text and scholarly content (paying attention to both object entries and stand-alone scholarly essays)
- special features (variable by catalogue and selected by each institution)
The focus groups themselves were conducted via Zoom videoconferencing, with 4–6 individuals per group. The group discussions were used as an opportunity to debrief on the homework exercises but also to explore further questions on the catalogues’ findability, utility for different types of scholarship, and other possibilities that target audiences would like to see the catalogues explore.