How much traffic are the catalogues receiving?
Web analytics provide a starting point for understanding traffic to the digital catalogues hosted by these museums. Each museum chose one catalogue to focus on for the analytics review, and analytic metrics for these four catalogues were compiled and compared, looking at overall traffic during a one-year period. (For more on the analytics study, see Appendix B: Methods in Depth — Analytics Review.)
Within the same one-year time frame, the four catalogues experienced widely different levels of activity when looking at the total number of recorded sessions. The NGA’s Dutch Paintings catalogue logged over 130,000 sessions, compared to roughly 3,000 for the PMA’s catalogue on the Johnson Collection.
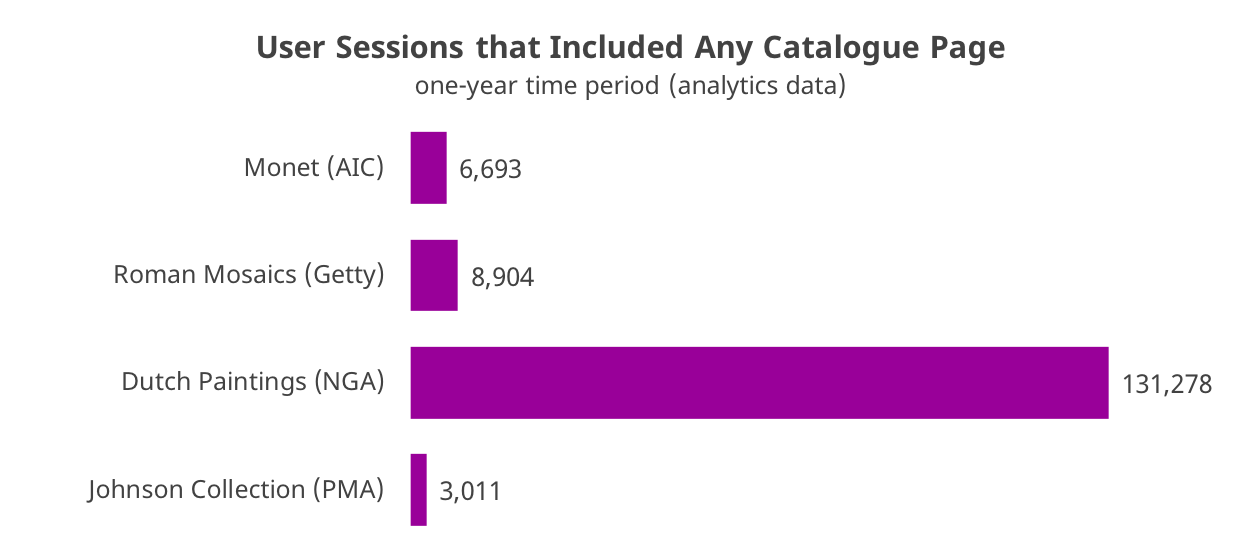
Although this discrepancy may suggest that the NGA catalogue was exponentially more popular than the others, the data should be interpreted with caution. The structure of the individual catalogues and their relationship to their respective museums’ websites has a large potential impact on the analytics collected. Artwork entries in the NGA’s digital catalogues are actually pages within the museum’s online collection pages, so any traffic generated by these pages is also tracked as catalogue traffic. Artwork entries for the other catalogues, in contrast, stand independent of their museums’ online collection pages. (For more information, see Appendix A: Further Analyses — The Unique Structure of the NGA’s Online Editions.)
To get a better sense of traffic by users who might be aware they are viewing a digital catalogue (as opposed to users who might touch briefly on a single artwork entry while browsing the larger museum website), we also looked at user sessions that included a visit to the catalogues’ homepages. Here the analytics data shows greater consistency across catalogues, although the NGA’s session count still exceeds the others.
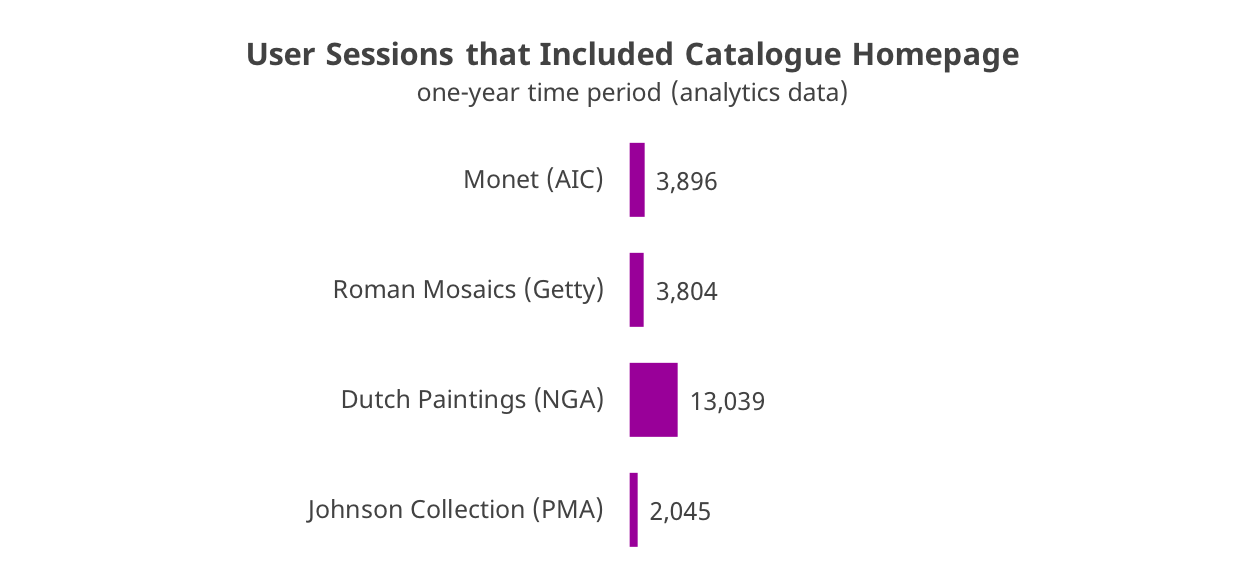
Sessions that include a visit to the catalogue’s homepage also show deeper levels of engagement by users, as measured by the duration of their visit and the number of pages viewed. (See What is the depth and breadth of a typical use session?) Focusing on sessions that hit upon the catalogues’ homepages may therefore be one way to filter out some of the analytics “noise” and narrow in on a target audience with a deeper interest in the catalogues’ content.