What is the depth and breadth of a typical use session?
Defining a “typical” use session for the digital catalogues is a difficult task, given the variety of audiences using the catalogues and their variety of reasons for visiting. (See How much traffic are the catalogues receiving? and Why do users visit the catalogues?) We know from our survey and focus group participants that many catalogue visits are driven by interest in a specific artwork, but users don’t necessarily end their visit after finding the entry they are seeking. Any number of paths might lead them deeper into the catalogue.
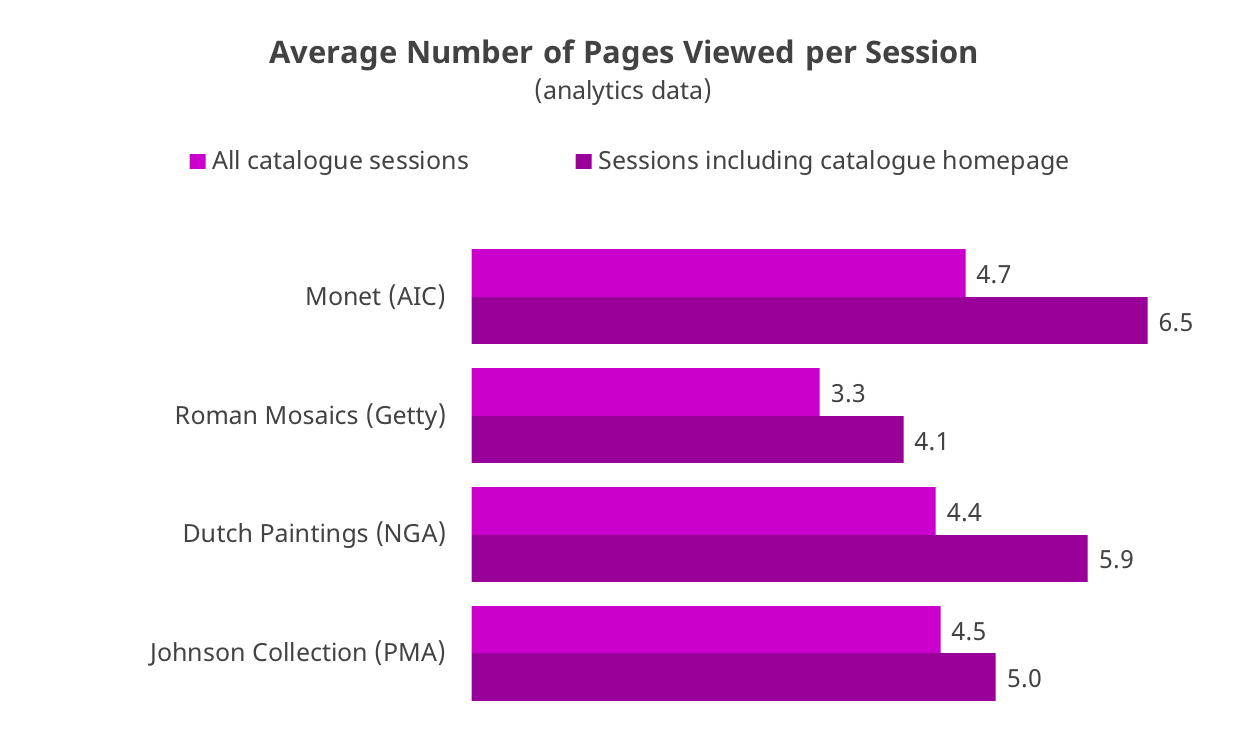
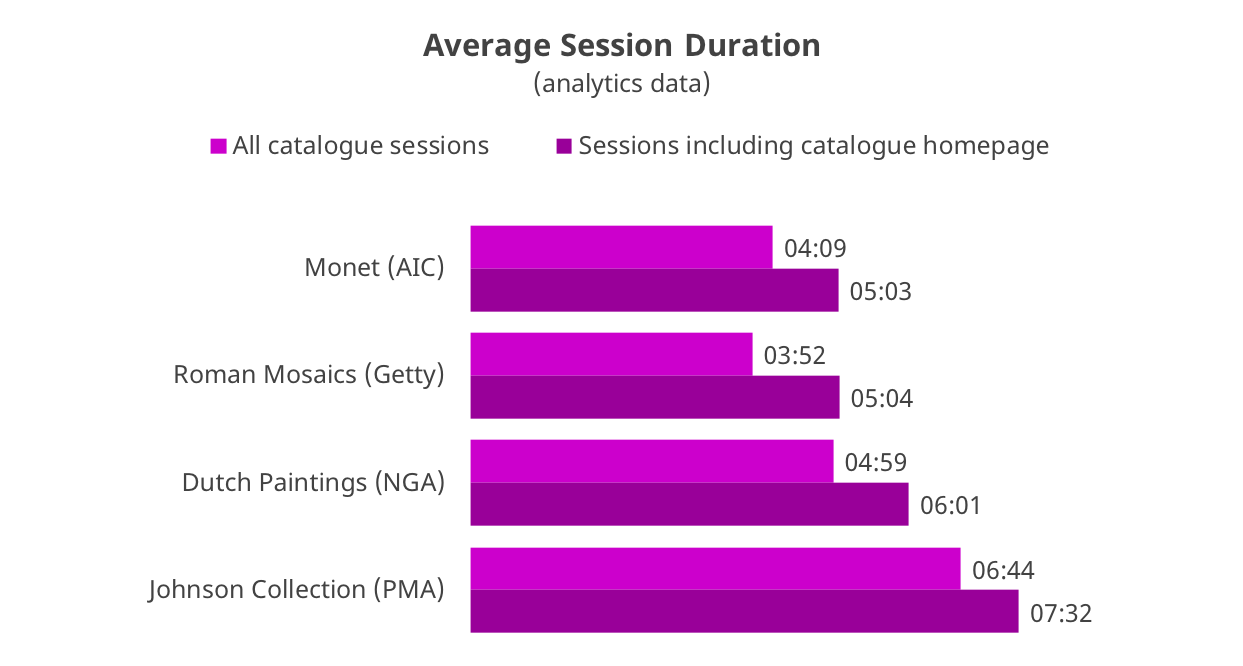
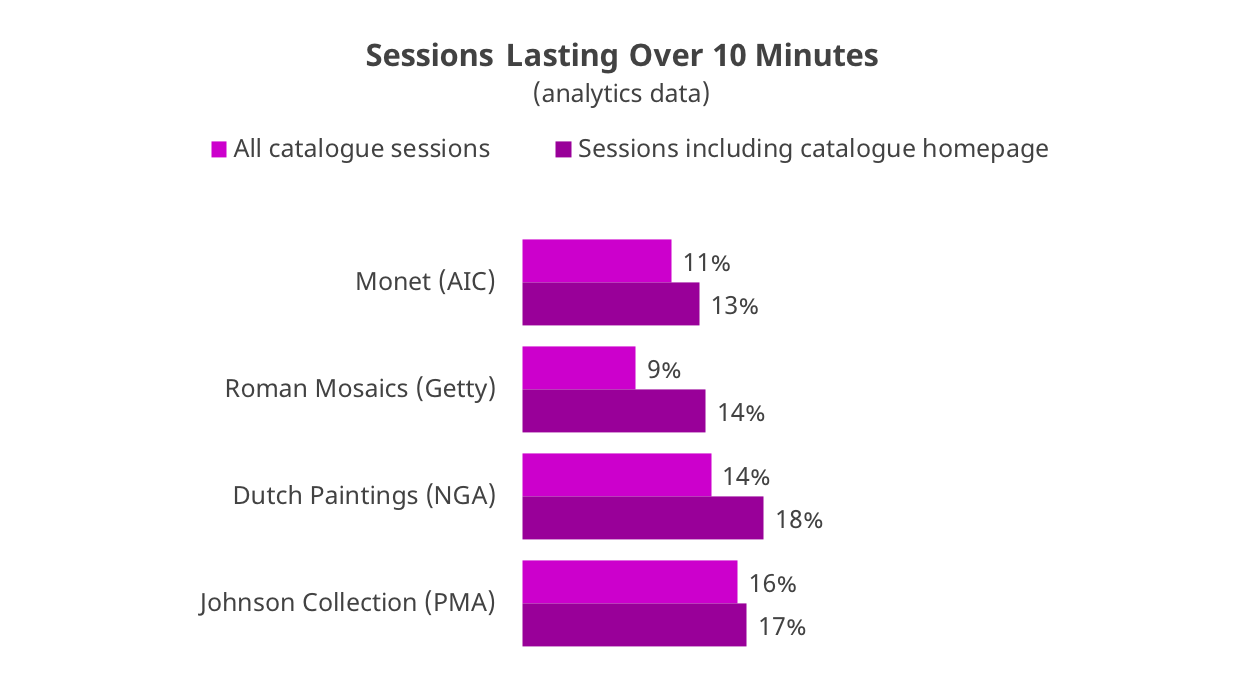
Analytics data can provide some insights on the “average” visit, but also must be interpreted with care. For example, the AIC, NGA, and PMA catalogues selected for the analytics review averaged around four pages per visit, while the Getty’s catalogue averaged slightly less. A lower number of pageviews might be interpreted as lower engagement with the catalogue, but it also might mean users are able to find what they need with fewer clicks. Average session duration can also easily be skewed by large numbers of sessions that last only a few seconds. Looking at the distribution of sessions of different durations is one way to look past the outliers.
| Catalogue | Pageviews per visit | Average session length (min:sec) | Percentage of sessions over 10 min |
|---|---|---|---|
| Monet (AIC) | 4.71 | 4:09 | 11.3% |
| Roman Mosaics (Getty) | 3.32 | 3:52 | 8.6% |
| Dutch Paintings (NGA) | 4.25 | 4:59 | 14.3% |
| Johnson Collection (PMA) | 4.47 | 6:44 | 16.3% |
Furthermore, if we look just at those sessions that included a visit to the homepage, the length and depth of a visit is extended. As noted elsewhere, this might give a more accurate picture of those users who are intentionally using the catalogue as opposed to accidentally landing on a catalogue page while browsing the larger museum website. (See How much traffic are the catalogues receiving?)
Given the notoriety of certain artworks, the team was also curious to know if particular famous works might be dominating traffic to the catalogues. The analytics show, however, that most users are arriving at the catalogues via the homepage and that no single art entry accounts for more than 5% of the pageviews received by any of the catalogues. (See Appendix A: Further Analyses — Top Pages Viewed and Top Landing Pages for more information.)


