Appendix A: Further Analyses
Jump to
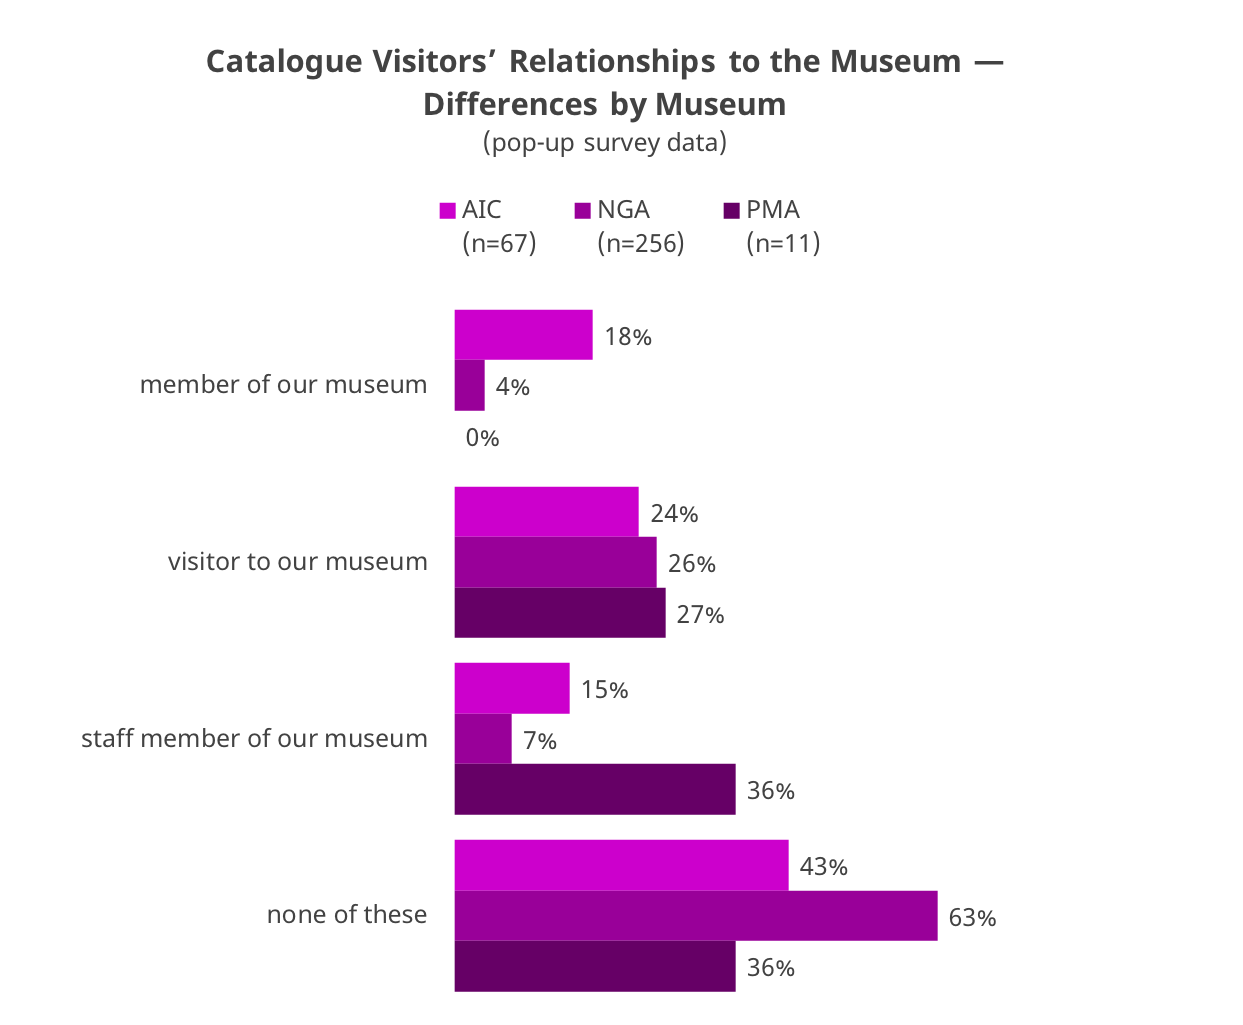
Users’ Relationships to the Museum — Breakdown by Institution
According to pop-up survey results, the AIC catalogues appear to be receiving more traffic from their members and staff than those of the NGA, where 63% said they had no affiliation with the institution. Due to the small sample size of PMA respondents, it is difficult to draw any conclusions about the makeup of their visitors from the pop-up survey data.
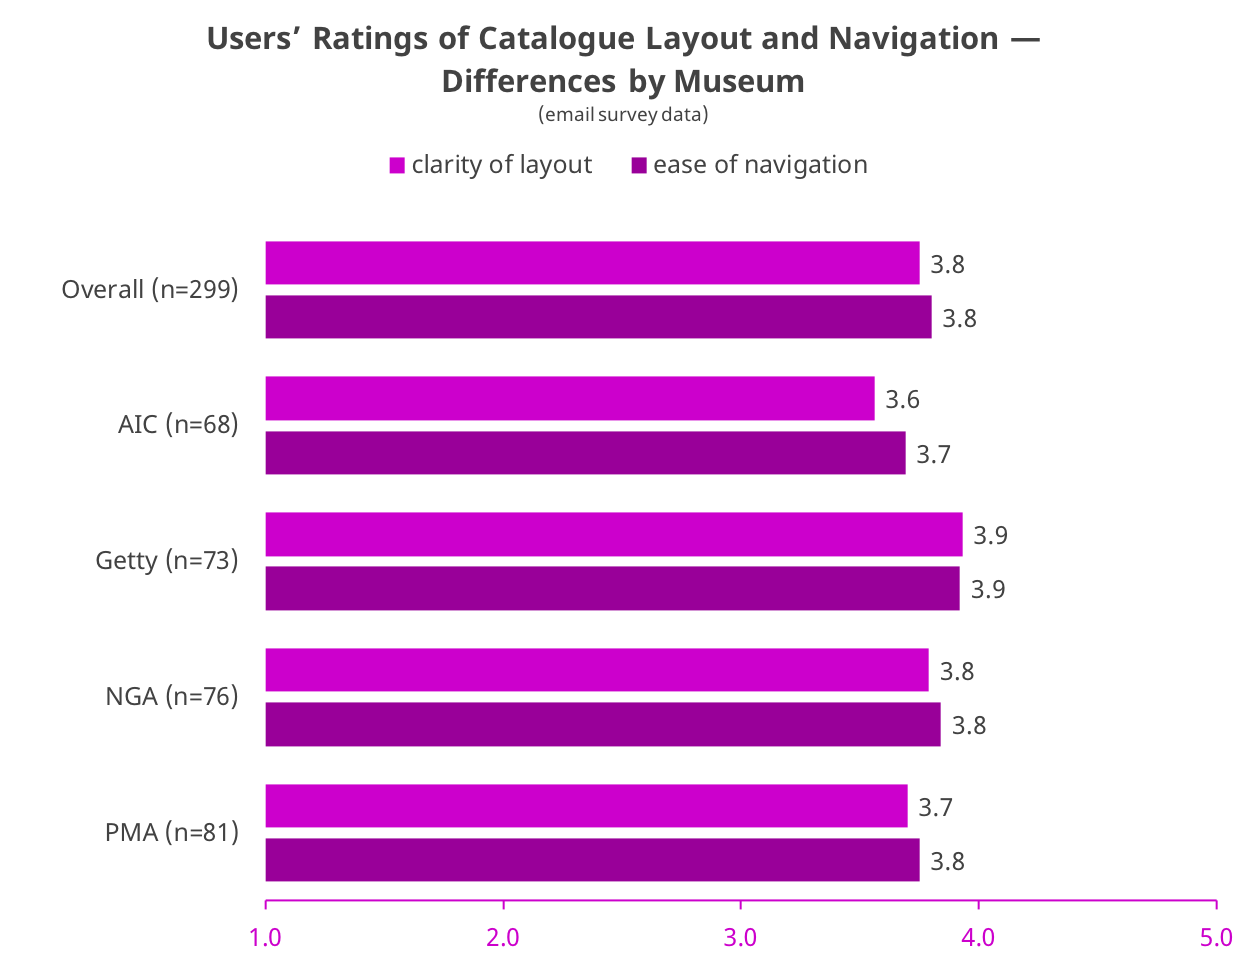
Catalogue Layout and Navigation Scores — Breakdown by Institution
Email survey respondents were asked to rate the catalogue they reviewed on its clarity of layout and ease of navigation. All four catalogues reviewed received fairly high scores, with no significant differences between them. This consistency in scores despite the variation in the catalogues suggests that users are adaptable to a range of designs.
Top Landing Pages for the Catalogues
Knowing where visitors land first when they enter the catalogues is important for understanding the user experience and providing proper navigation throughout the catalogues. The analytics reviewed for this study show that the bulk of users land first on the catalogues’ homepages. The NGA’s Dutch Paintings catalogue is again the exception owing to its unique structure, which ties the catalogue into the museum’s general collection pages (see The Unique Structure of the NGA’s Online Editions below).
| Catalogue | Page | % of sessions started here |
|---|---|---|
| Monet (AIC) n=6695 sessions |
Homepage | 50% |
| Object entry | 3% | |
| Homepage (url variation) | 3% | |
| Dutch Paintings (NGA) n=131,420 sessions |
Object entry | 9% |
| Homepage | 7% | |
| Object entry | 4% | |
| Roman Mosaics (Getty) n=5913 sessions |
Homepage | 42% |
| Geographic grouping - North Africa | 9% | |
| Geographic grouping - Italy | 7% | |
| Johnson Collection (PMA) n=3011 sessions |
Homepage | 61% |
| Publications home | 4% | |
| Homepage (different url) | 3% |
Top Pages Viewed in the Digital Catalogues
Considering individual artworks are driving many users’ interest in these digital catalogues, the team asked whether traffic to particular artwork entries is dominating their sites’ overall traffic. A glance at the top ten pages for each catalogue shows this is not the case. At the most, a single object entry might account for up to 5% of the total pageviews received by a catalogue, and this is true only of the Getty’s Roman Mosaics catalogue. This catalogue has fewer art entries overall, so single artworks necessarily receive a higher percentage of the traffic. In the other catalogues, single artworks only account for up to 3% of the total pageviews logged. Instead, the catalogues’ homepages generally receive the most traffic, although significantly less for the NGA’s catalogue, owing to its unique structure. (See The Unique Structure of the NGA’s Online Editions below.)
Top Referring Sites
(analytics data)
Catalogue
Source
% of sessions
Monet (AIC)
n=519 sessionslabreuche-fournisseurs-artistes-paris.fr
7%
artsandculture.google.com
6%
en.wikipedia.org
6%
mail.google.com
5%
www3.nd.edu
5%
lms.brocku.ca
4%
aic.prod.a17.io
3%
getty.edu
3%
m.weibo.cn
3%
blogs.getty.edu
3%
Dutch Paintings (NGA)
n=18,801 sessionsconnexus.com
26%
brightspace.indwes.edu
5%
m.facebook.com
5%
classroom.google.com
4%
wps.prenhall.com
3%
openculture.com
3%
essentialvermeer.com
2%
thecatholicthing.org
2%
thedailybeast.com
2%
en.wikipedia.org
2%
Roman Mosaics (Getty)
n=274 sessionsgetty.edu
50%
duckduckgo.com
6%
gettydocents.volunteerportal.org
6%
joanannlansberry.com
6%
ku-primo.hosted.exlibrisgroup.com
6%
netfind.com
6%
pinterest.co.uk
6%
t.co
6%
yandex.ru
6%
Johnson Collection (PMA)
n=559 sessions207.246.94.144
40%
localhost:3000
11%
dp.la
9%
pacscl.exlibrisgroup.com:48994
8%
omnia.le
4%
philamuseum.createsend.com
3%
academia.edu
2%
arlisna.org
2%
librarystack.org
2%
philadelphiamuseumofart.sharepoint.com
2%
Tool Findability — Differences between Catalogues
Email survey participants were asked to search for and use a variety of specific tools while exploring their assigned catalogue, and report back on the ease of both finding and using them. For a variety of tools (but not all), the PMA’s Johnson catalogue and the NGA’s Dutch Paintings tended to perform slightly better than the AIC’s Matisse catalogue and the Getty’s Roman Mosaics.
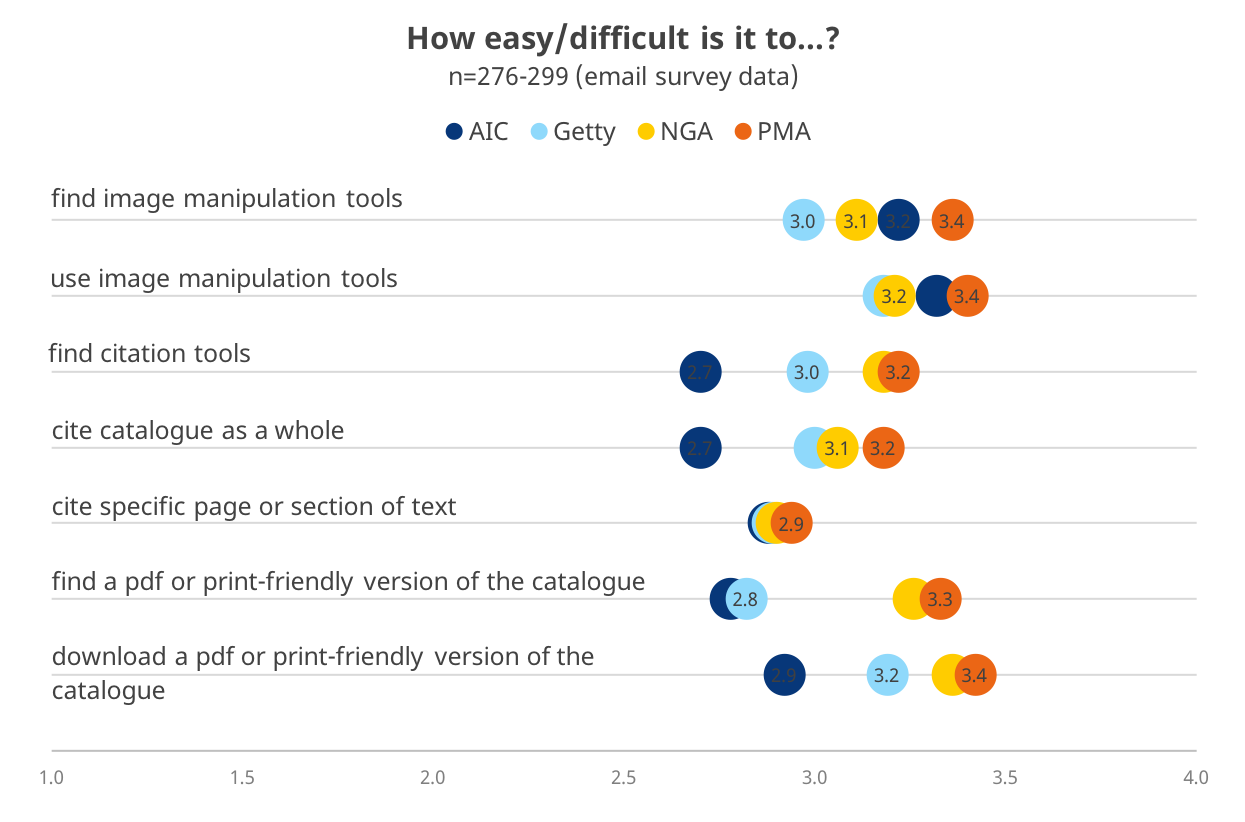
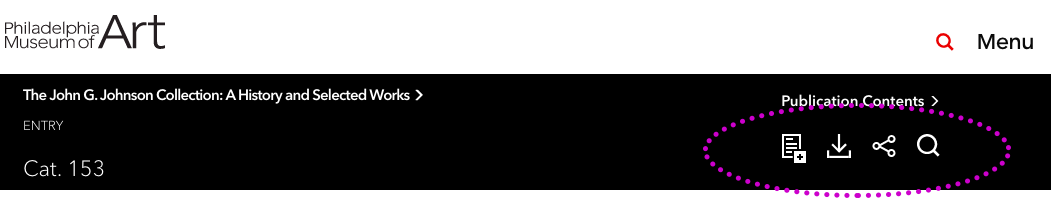
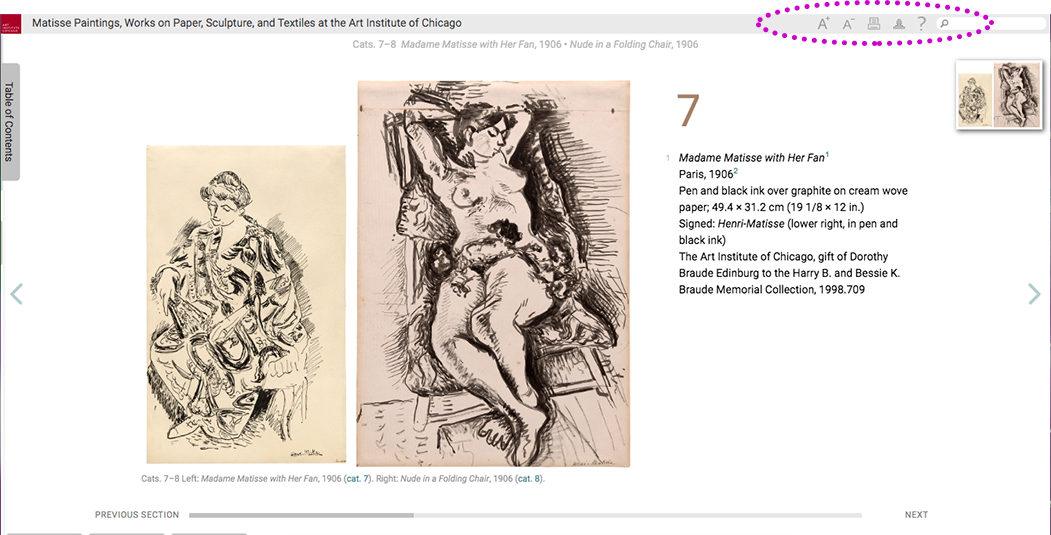
Both the NGA and PMA group their tools in a single spot, which appealed to participants in the focus groups. The NGA also clearly labels the tools with text, while the PMA uses ScreenTips to explain the function of their tool icons. These conventions result in a slightly less streamlined design (for example, compared to the AIC’s discreet gray icons) but quicker navigation for users.
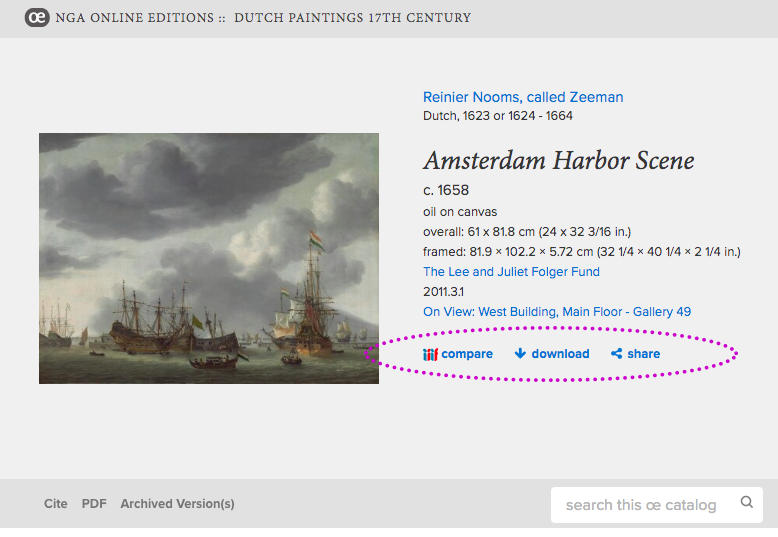
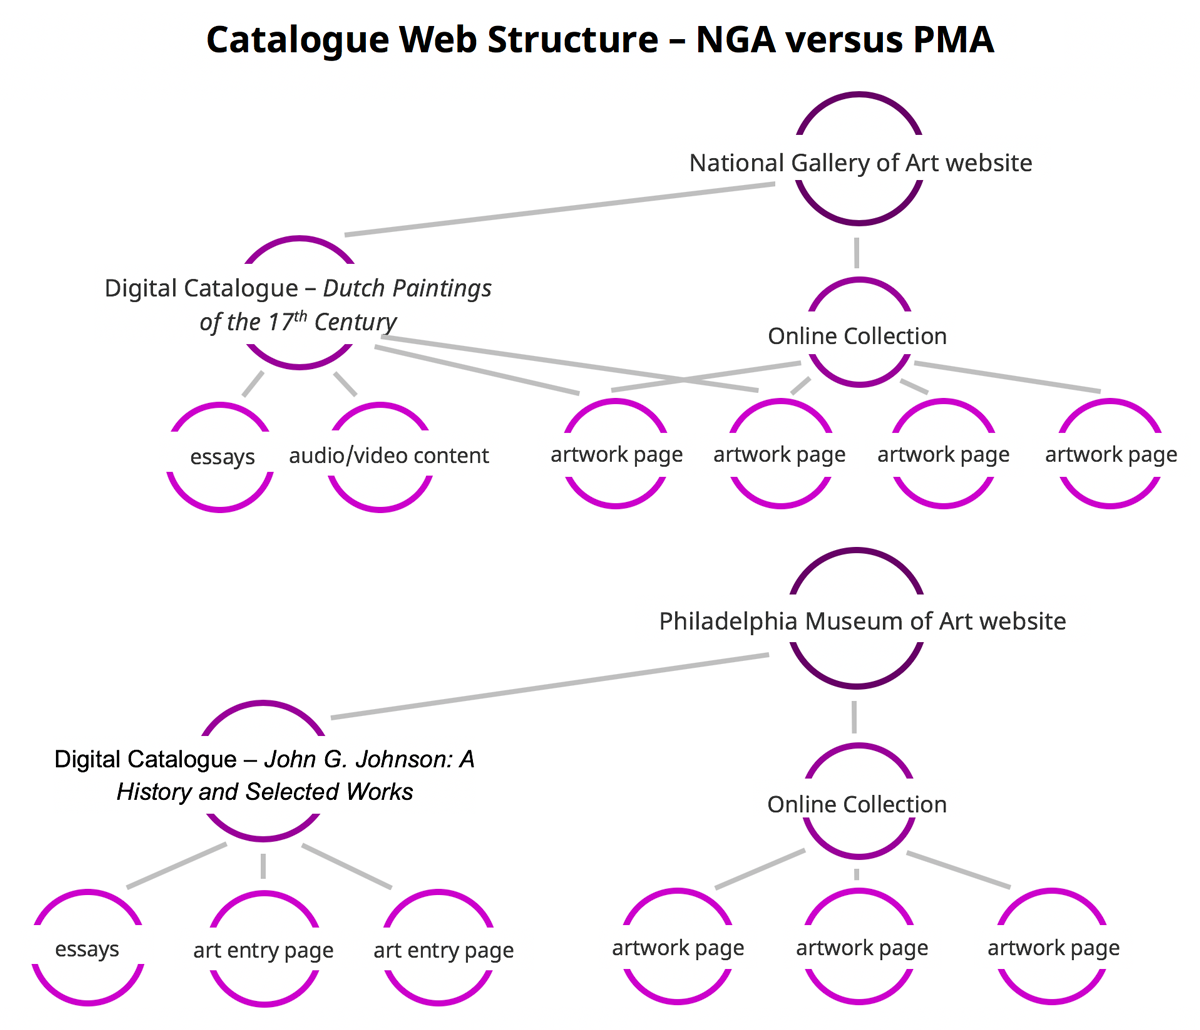
The Unique Structure of the NGA’s Online Editions
Unlike the other catalogues in our study, the NGA’s Dutch Paintings catalogue and all of its Online Editions incorporate art object pages from the museum’s online collection as artwork entry pages in the catalogue, essentially allowing the pages to do double duty for the catalogue and online collection. This structure has a number of implications for the catalogue, its visitation, and how Google Analytics tracks traffic to the catalogue. The collection pages on the NGA website receive large numbers of visitors, which Google Analytics therefore interprets as catalogue traffic, regardless of whether visitors are aware of the catalogue. As a result, the Dutch Paintings catalogue appears to be receiving a much higher level of traffic than the other catalogues in this study. (See How much traffic are the catalogues receiving?) Its homepage, however, receives a much smaller percentage of traffic in relation to other pages in the catalogue and serves as the landing page (entry point) for only 7% of catalogue visitors. (See Top Pages Viewed and Top Landing Pages above.)
Although the structure of the NGA’s catalogue means that its analytics must be interpreted with care, the art object pages have the potential to draw in additional users who otherwise might not have known about the catalogue. The challenge for the museum is helping users understand the relationship between the catalogue and the museum’s online collections, and when they’ve crossed over from one to the other.